
A production line can look healthy and still miss its output target. The filler is cycling, the capper is running, bottles are moving on the conveyor, and there is no obvious long breakdown. Yet the finished-bottle count at the end of the line continues to fall behind.
That is where production line bottleneck analysis becomes more useful than simply comparing machine nameplate speeds. The real question is how the complete filling and capping machine line behaves when bottle supply, filling, transfer, cap feeding, accumulation and restart recovery interact under normal production conditions.
| Required Output | Cycle Time | Starvation & Blocking | Buffer Strategy | Micro-Stops | Bottleneck Analysis | Review Data | FAQ |
When the Filler Stops, the Filler May Not Be the Problem
Consider a common production sequence. The cap-feed system pauses for only a few seconds. The capper stops waiting for closures, but the filler continues producing. Filled bottles begin collecting between the two machines. Once the available accumulation is used up, the filler can no longer release its bottles and it stops too.
If the team only looks at the final machine alarm, the filler appears to be the problem. In reality, the event started farther downstream.
| Bottle Supply | → | Filling | → | Transfer / Buffer | → | Capping | → | Finished Output |
The bottleneck may sit at one process, but its visible effect can travel through the entire line.
The opposite can happen as well. If empty bottles arrive irregularly, the filler becomes starved, the conveyor gradually empties, and the capper eventually stops because there are no bottles to cap. Again, the machine that stops last is not necessarily the machine limiting production.
This is why useful bottleneck analysis follows the sequence of events, not just the location of the final stop.
The Number That Matters Is Finished Output at the End of the Line
A filler may be capable of running faster than the production target. A capper may also be capable of running faster. That still does not prove the connected line can maintain the required finished output for an hour, a shift or a full production campaign.
The first useful reference is therefore the number of acceptable finished units leaving final discharge during a defined period. Everything upstream should be compared with that same basis.
Required output — what the production plan actually needs.
Active station rate — what an individual machine produces while it is processing normally.
Effective line rate — what reaches final discharge after waiting, blocking, micro-stops and recovery are included.
That distinction immediately changes the diagnosis. If a filler runs quickly whenever it is active but spends significant time blocked, increasing filling speed will not solve the problem. If the active filling process itself remains too slow even when bottles arrive continuously and discharge is clear, then filling capacity becomes a much stronger suspect.
Peak speed should also stay separate from sustainable speed. A clean five-minute run proves that a mechanism can move quickly. It does not show how the line behaves after normal cap replenishment, bottle variation, minor corrections, changeovers and repeated short interruptions begin to accumulate.
Keep the SKU beside every measurement. A free-flowing liquid, a viscous product, a tall lightweight bottle and a short stable bottle can expose completely different limits on the same installed line.
Read the Line as One Sequence, Not Three Separate Machines
The easiest way to understand a connected line is to follow the bottle. Watch when it arrives, when it is processed, when it leaves, and when the next station can accept it. That makes it much easier to distinguish a genuine slow process from a machine that is simply waiting on something else.
At filling, look at what happens before and after the actual fill
The filling cycle is not just the time during which liquid enters the bottle. Bottle presentation, positioning, fill behavior and release can all affect the next cycle.
If the filler is waiting for empty bottles, there is still unused filling capacity. If the dose is complete but bottles cannot leave, the restriction is downstream. Only after those two conditions have been ruled out should the active filling process itself become the main capacity suspect.
When filling is confirmed as the constraint, compare filling machine options against the actual liquid, bottle, dosing, cleaning and required production rate instead of starting with a catalog speed comparison.
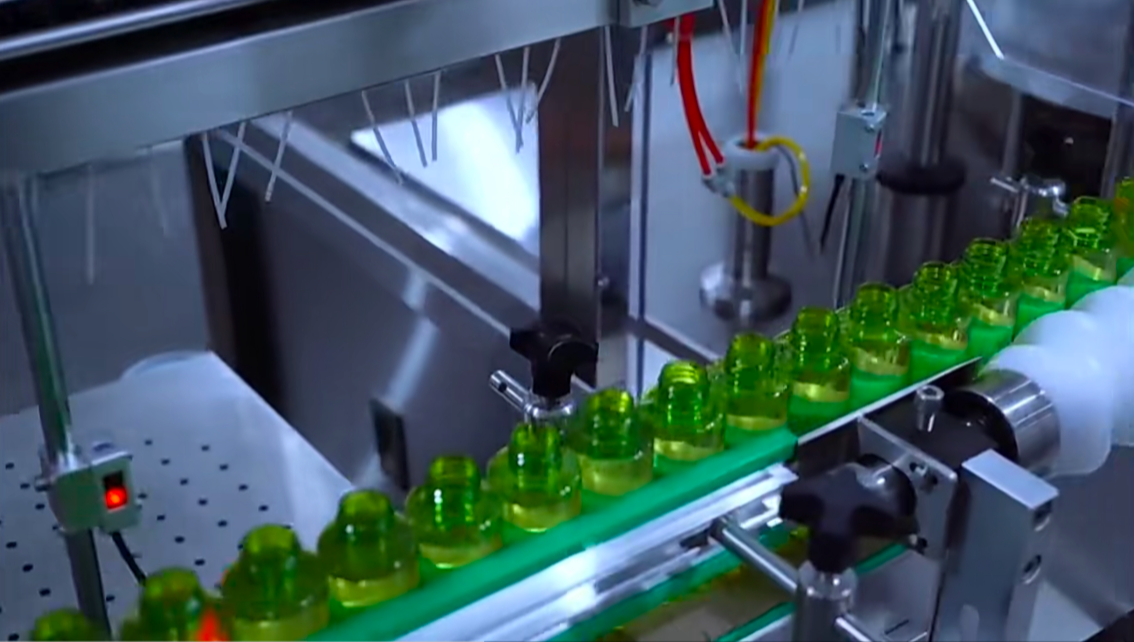
Bottle movement between stations should be judged by usable spacing and downstream demand, not by conveyor movement alone.
At capping, separate cap supply from the capping mechanism
A capper can appear slow for several very different reasons. It may be waiting for bottles. It may be waiting for closures. An operator may repeatedly correct misfed caps. Or the actual bottle-control and cap-application cycle may simply be slower than the required line rate.
Those conditions should not be averaged into one generic “capping speed.” A capper that immediately returns to normal production once closure supply recovers does not have the same problem as a capper that stays slow while bottles and closures remain continuously available.
If the active capping process remains the confirmed constraint, review suitable capping machine options against the actual closure, bottle-control and output requirements.
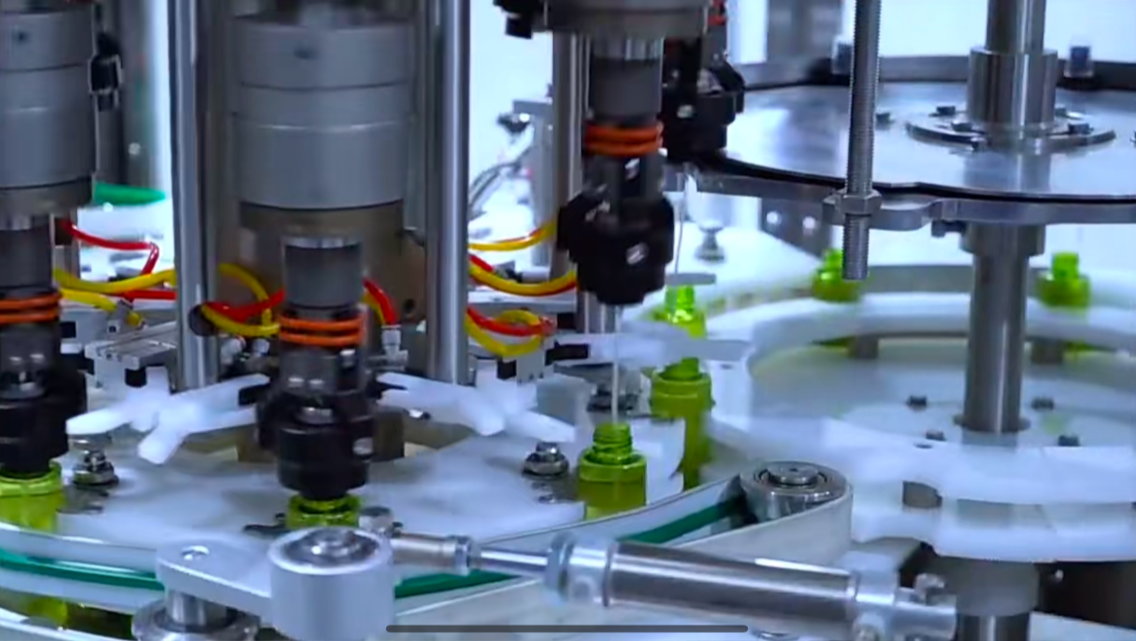
A useful capping-capacity check keeps bottle presentation, closure availability, positioning, application and discharge visible as separate parts of the cycle.
| View Integrated Equipment → | Explore Capping Machines → |
On the conveyor, movement is not the same as usable capacity
A conveyor can keep running while usable bottle flow is already deteriorating. Large gaps, bunching, bottle leaning, abrupt guide transitions and repeated sensor interruptions can reduce the number of containers arriving at the next station in the spacing and orientation that station actually needs.
A simple way to check this is to follow the same visible group of bottles from filler discharge to capping infeed. If the capper repeatedly waits while bottles are visibly present farther upstream, the transfer section deserves attention.
Effective Conveyor Transfer Rate = Acceptable Bottles Delivered to the Next Station ÷ Observation Time
Count bottles that arrive in a usable condition. A bottle passing a sensor does not necessarily mean the next machine can process it without interruption.
The Bottle Queue Often Tells You More Than the Alarm Screen
Two of the most useful line states are starvation and blocking because they show which direction to investigate.
|
Starvation travels downstream → When bottles, closures or another required input do not arrive, the affected station waits and the loss eventually reaches the next process. |
← Blocking travels upstream When downstream space disappears, completed product cannot leave and the restriction moves back toward upstream equipment. |
Accumulation sits between those two conditions. It can temporarily hide a mismatch, but the direction in which the bottle queue moves is useful evidence.
| Filler repeatedly becomes blocked | Look downstream at capping, discharge and accumulation before increasing filler speed. |
| Capper repeatedly becomes starved | Look upstream at filler release, bottle gaps and transfer continuity before increasing capping speed. |
| Buffer keeps filling | Upstream supply is exceeding downstream consumption. The downstream process deserves closer measurement. |
| Buffer keeps emptying | Upstream supply is not keeping up. Look for bottle gaps, low output or repeated upstream interruptions. |
The sequence matters just as much as the direction. A short closure interruption can stop the capper first, fill the accumulation section second and block the filler third. Recording only the final filler alarm hides the chain that actually caused the lost output.
A Bigger Buffer Helps Only When the Problem Is Temporary
Accumulation is useful because neighboring machines do not always need to stop together. Bottles stored before a critical station can keep that machine supplied during a brief upstream interruption. Free conveyor space after it can provide temporary protection from a short downstream stop.
But a buffer cannot manufacture missing processing capacity. If the capper can sustainably handle fewer bottles per hour than the line actually requires, adding conveyor only delays the point at which the queue becomes full.
The same applies to unstable bottle handling. More accumulation can actually make the situation worse when tall, lightweight, flexible or irregular containers begin leaning, pushing or changing spacing as pressure increases.
Short interruption + enough usable accumulation → the buffer can isolate the disturbance.
Persistent station capacity deficit → more conveyor only delays the eventual stop.
Unstable bottles under accumulation → extra buffer can create a new handling problem.
For that reason, usable accumulation is better expressed as protection time than as conveyor length alone.
If upstream supply stops completely:
Protection Time = Usable Accumulated Units ÷ Downstream Consumption Rate
If downstream flow stops completely:
Time Until Buffer Fills = Available Empty Buffer Capacity ÷ Upstream Production Rate
If both processes continue at different rates:
Time to Buffer Limit = Usable Buffer Capacity ÷ |Upstream Rate − Downstream Rate|
These figures are most useful when compared with the interruptions that actually occur. If the buffer protects the capper for only a short period but the typical upstream disturbance lasts much longer, the neighboring processes will still become coupled.
A Fast Line Can Lose Its Shift in Ten-Second Pieces
Long breakdowns are easy to notice. Micro-stops are more deceptive. An operator straightens a bottle, resets a sensor, clears one cap and production resumes. Because each event is short, it rarely feels like the main production problem.
Repeated throughout a shift, those events can remove a large amount of finished output.
Recovery also matters. A ten-second stop does not always create only ten seconds of production loss. Bottle spacing may remain uneven after restart, accumulation may need to rebuild, or one small interruption may trigger several secondary stops farther along the line.
Record the condition, not just the operator action. “Operator reset” says very little. “Bottle tilted at capping infeed, then operator reset” gives the engineering team something specific to investigate.
Planned work should stay separate from abnormal recovery. Cleaning, replenishment and SKU changeover reduce available production time, but they require different solutions from repeated mechanical or bottle-handling faults.
The bottleneck may also move after a changeover. One liquid may make filling the slowest operation. Another SKU may run easily through filling but become unstable at a guide transition. A different closure may expose cap-feeding or application limits. One universal bottleneck assumption is therefore rarely enough for a mixed-SKU line.
Turn the Production Pattern Into a Testable Bottleneck Hypothesis
You do not need invented machine-speed assumptions to make the analysis quantitative. A few measured rates and a clear record of line states are usually enough to decide where the next investigation should go.
Required Net Line Rate
Required Acceptable Finished Units ÷ Available Production Time
Station Capacity Ratio
Measured Sustainable Station Rate ÷ Required Net Line Rate
Effective Conveyor Transfer Rate
Acceptable Bottles Delivered to the Next Station ÷ Observation Time
The same observation period can then be divided into running, starved, blocked, faulted and manual-recovery states. That prevents very different production problems from disappearing inside one average output figure.
For example, a capper that spends a large part of the study starved is not automatically a candidate for a faster capping mechanism. A filler that spends substantial time blocked is not automatically short of filling capacity.
Change one meaningful variable at a time. Establish a baseline, adjust the suspected constraint, and repeat the same observation. If increasing a local machine speed only creates more accumulation or blocking, finished output has not actually improved.
When the Bottleneck Really Is a Machine-Capacity Problem
Not every low-output line needs another machine or a faster machine. Equipment comparison becomes useful after interaction losses have been separated from true process capacity.
If filling remains below the required rate while bottle supply is stable and discharge remains clear, then the filling process deserves a closer equipment review. If capping stays behind while bottles and closures are continuously available and downstream discharge is unrestricted, the capping process becomes the stronger candidate.
If neither machine is consistently slow on its own but the connected line loses output through repeated blocking, starvation and unstable transfer, the better solution may involve the way the complete line is integrated rather than replacing one station in isolation.
Integrated Filling & Capping Equipment →
Useful when filling, capping, bottle transfer and available line space need to be evaluated as one system.
Linear Filling Machines →
Relevant after the active filling process is confirmed as the limiting operation.
Rotary Capping Machines →
Relevant when closure handling, bottle control or active capping capacity is confirmed as the constraint.
What Makes a Line Review Actually Useful
A supplier can do much more with a clear description of the production loss than with a general request for “a faster line.” The useful information is the evidence that shows when output disappears and what the line is doing immediately before that happens.
Before a technical review, collect the target and current sustainable output for the important SKUs, representative filling and capping timing, bottle and closure information, and a simple conveyor layout showing the direction of flow and the main accumulation areas.
Short production videos are particularly useful when the issue involves bottle spacing, leaning, cap feeding or recovery after a stop. A video showing the period immediately before and after the event can provide more context than a long list of alarm codes.
Also note which interruptions repeat, how frequently operators intervene, and whether the problem changes after a SKU changeover. These details help distinguish an equipment-capacity problem from a package-handling or line-integration problem.
Bring the Bottleneck, Not Just the Target Speed
For a line-balancing discussion, send the required finished output, the SKU that shows the problem, current filling and capping behavior, bottle and closure details, conveyor layout, usable accumulation and a short record or video of the recurring interruption.
That gives the technical team enough context to decide whether the next step should focus on filling capacity, capping capacity, bottle transfer, buffer strategy or the way the complete filling and capping line is integrated.
| Send Line Details for Review → | Review Integrated Equipment → |
Frequently Asked Questions
Why can a production line miss its target even when every machine appears fast enough?
Individual machine speeds do not include all of the losses created when machines operate together. Bottle gaps, closure starvation, blocking, unstable transfer, micro-stops, recovery and changeovers can reduce final output even when each machine has enough theoretical capacity.
How can I tell whether the filler or capper is the actual bottleneck?
Separate active processing from waiting and blocking. A filler that is frequently blocked is usually being constrained downstream. A capper that is frequently starved is usually waiting on upstream bottle or closure supply. The stronger bottleneck candidate is the process that remains below the required sustainable rate while its required inputs and discharge conditions are stable.
Will adding more conveyor buffer solve a production bottleneck?
A buffer can isolate short disturbances and reduce the chance that neighboring machines stop together. It cannot permanently compensate for a station whose sustainable output remains below the required line rate. Bottle stability must also be considered because some containers become difficult to control as accumulation increases.
What should I provide when asking a supplier to review a line bottleneck?
Provide the required finished output, current sustainable output, affected SKU, filling and capping observations, bottle and closure details, conveyor layout, usable accumulation, recurring stop history and short production videos. These details help separate a machine-capacity problem from a transfer, feeding or line-integration problem.